Dataset in support of the journal article 'Phase identification despite amplitude variation in coherent beam combination using deep learning'
Dataset in support of the journal article 'Phase identification despite amplitude variation in coherent beam combination using deep learning'

This dataset contains: Figure_1.png to Figure_9.png
The figures are as follows:
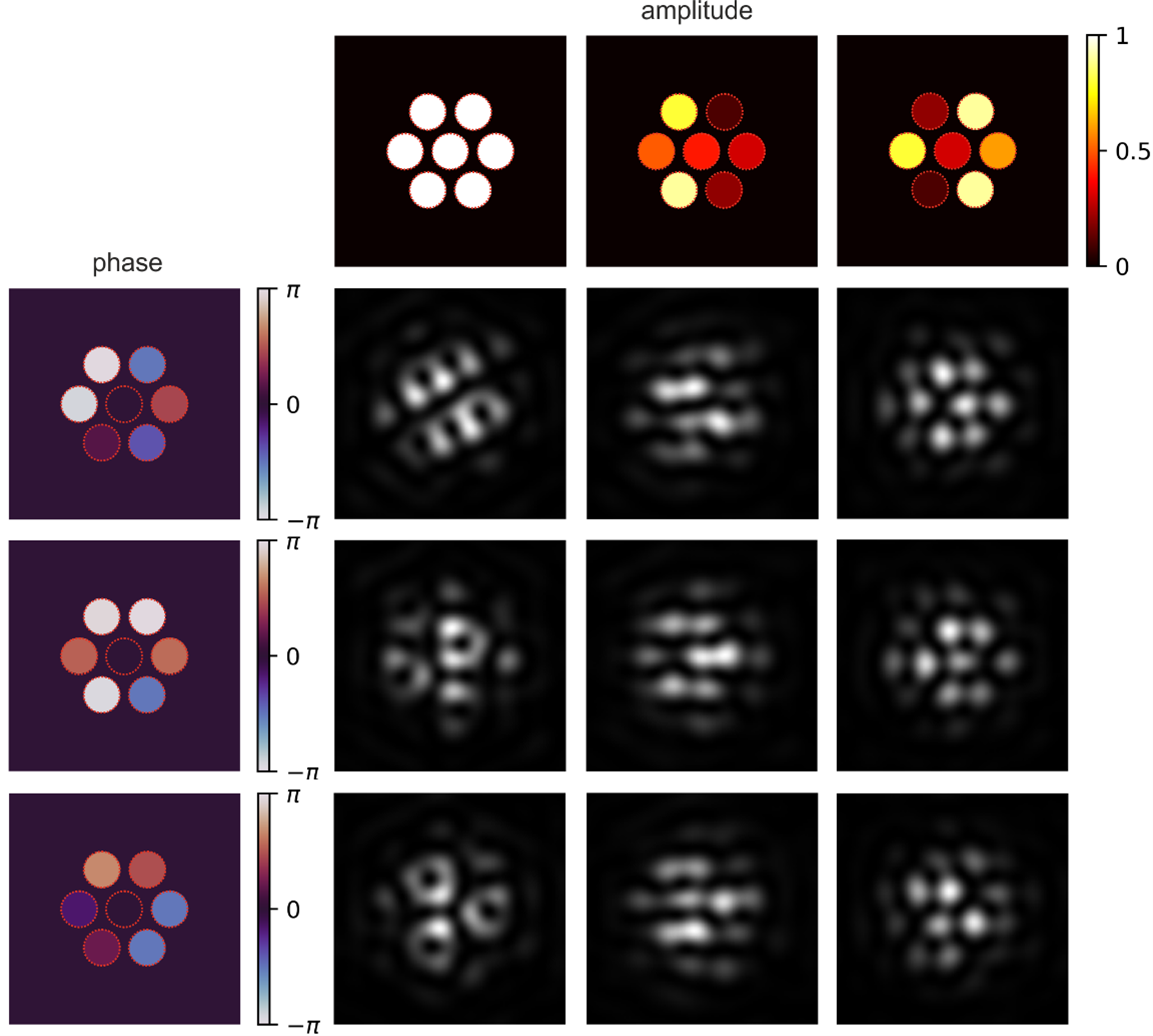
Figure_1.png Fig. 1. Simulated far-field intensity patterns corresponding to different combinations of phase values and amplitude values.
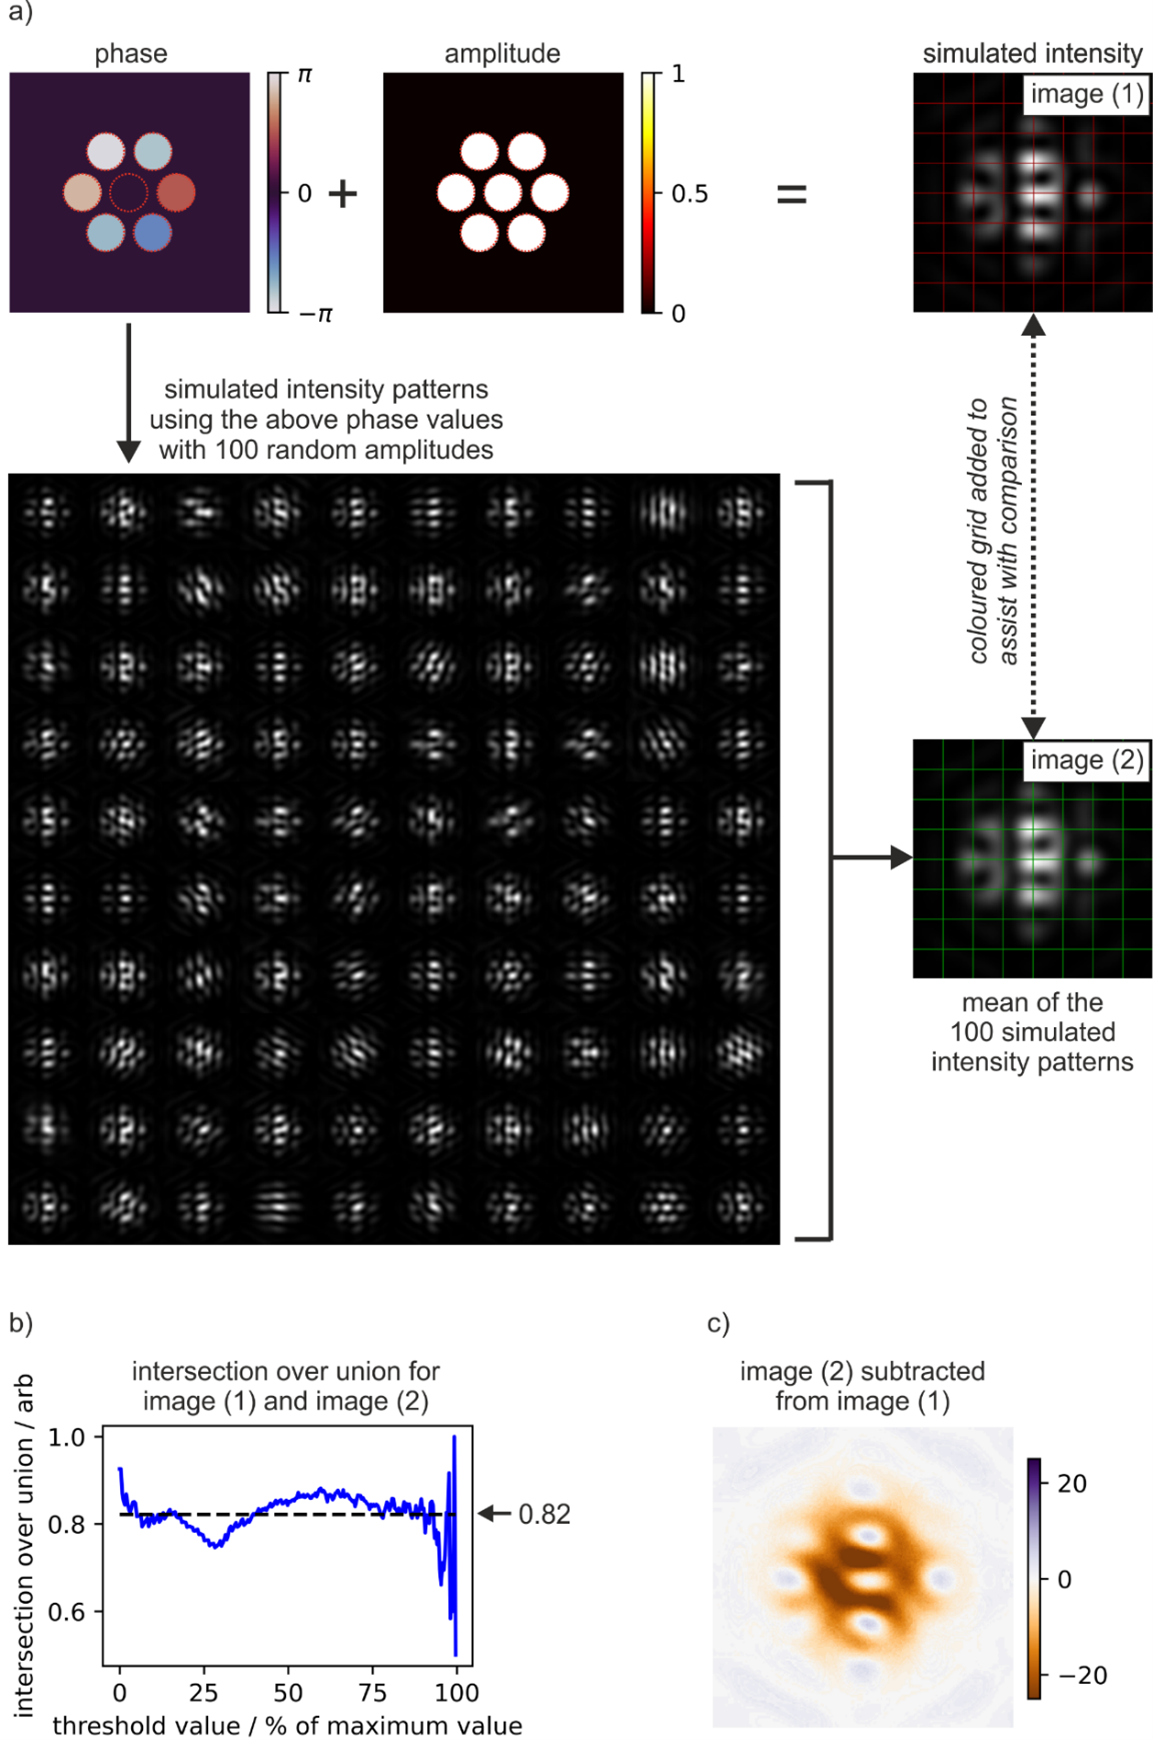
Figure_2.png Fig. 2. Showing a) that the intensity pattern for equal amplitude values is comparable to the mean of the intensity patterns for non-equal amplitude values, with quantitative metrics of b) intersection over union and c) image subtraction.
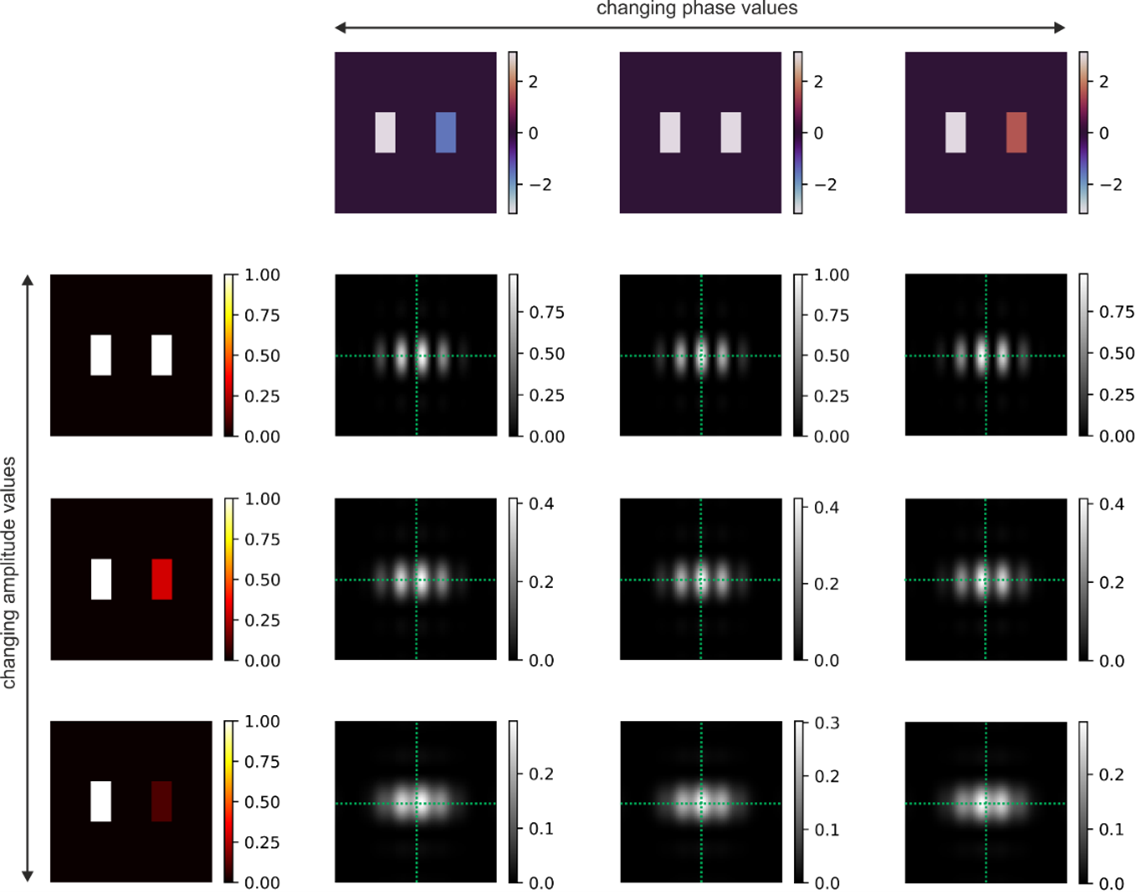
Figure_3.png Fig. 3. Simulated far-field diffraction patterns from two slits, for changing amplitude and phase values. The dotted green lines are included for assisting with visual comparison.
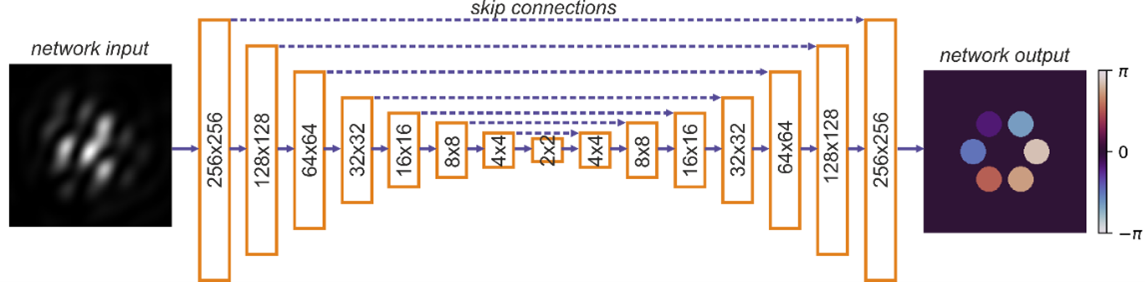
Figure_4.png Fig. 4. Schematic of the image-to-image network used for transforming simulated diffraction patterns into predictions of phase.
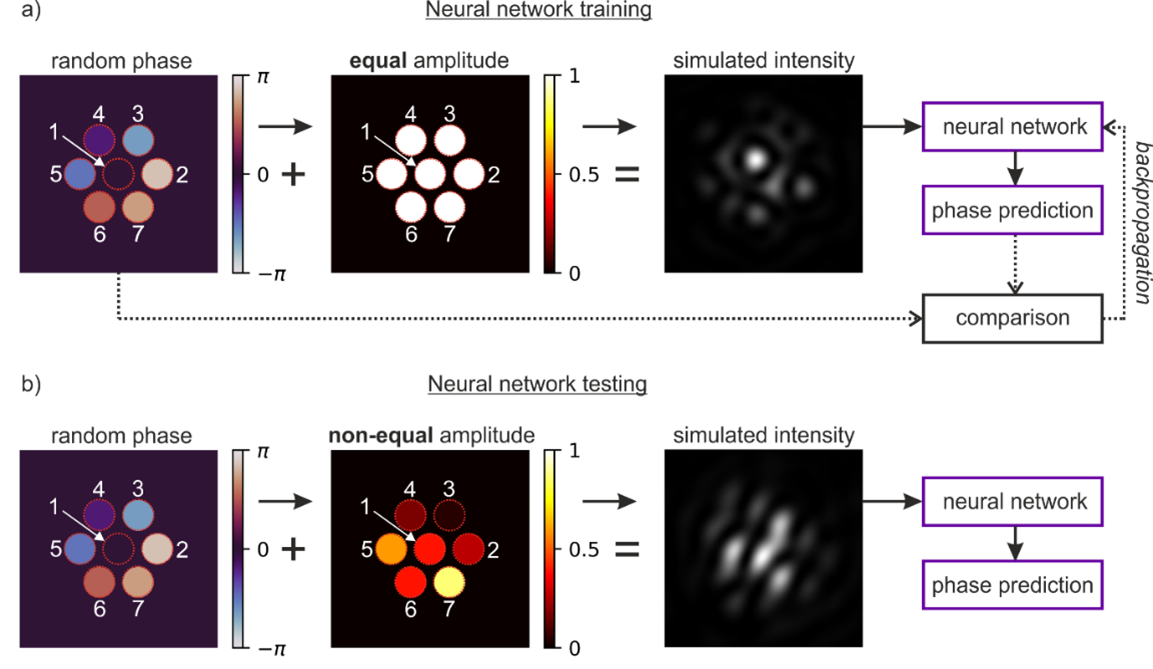
Figure_5.png Fig. 5. Concept for training and testing the neural network. The neural network is trained to identify phase values from simulated far-field intensity patterns. The training data contains intensity patterns corresponding to random phase values and equal amplitude values (the amplitudes are always set to a value of one). The testing data contains intensity patterns corresponding to random phase values and random amplitude values (the amplitudes are chosen from a uniform distribution from zero to one).
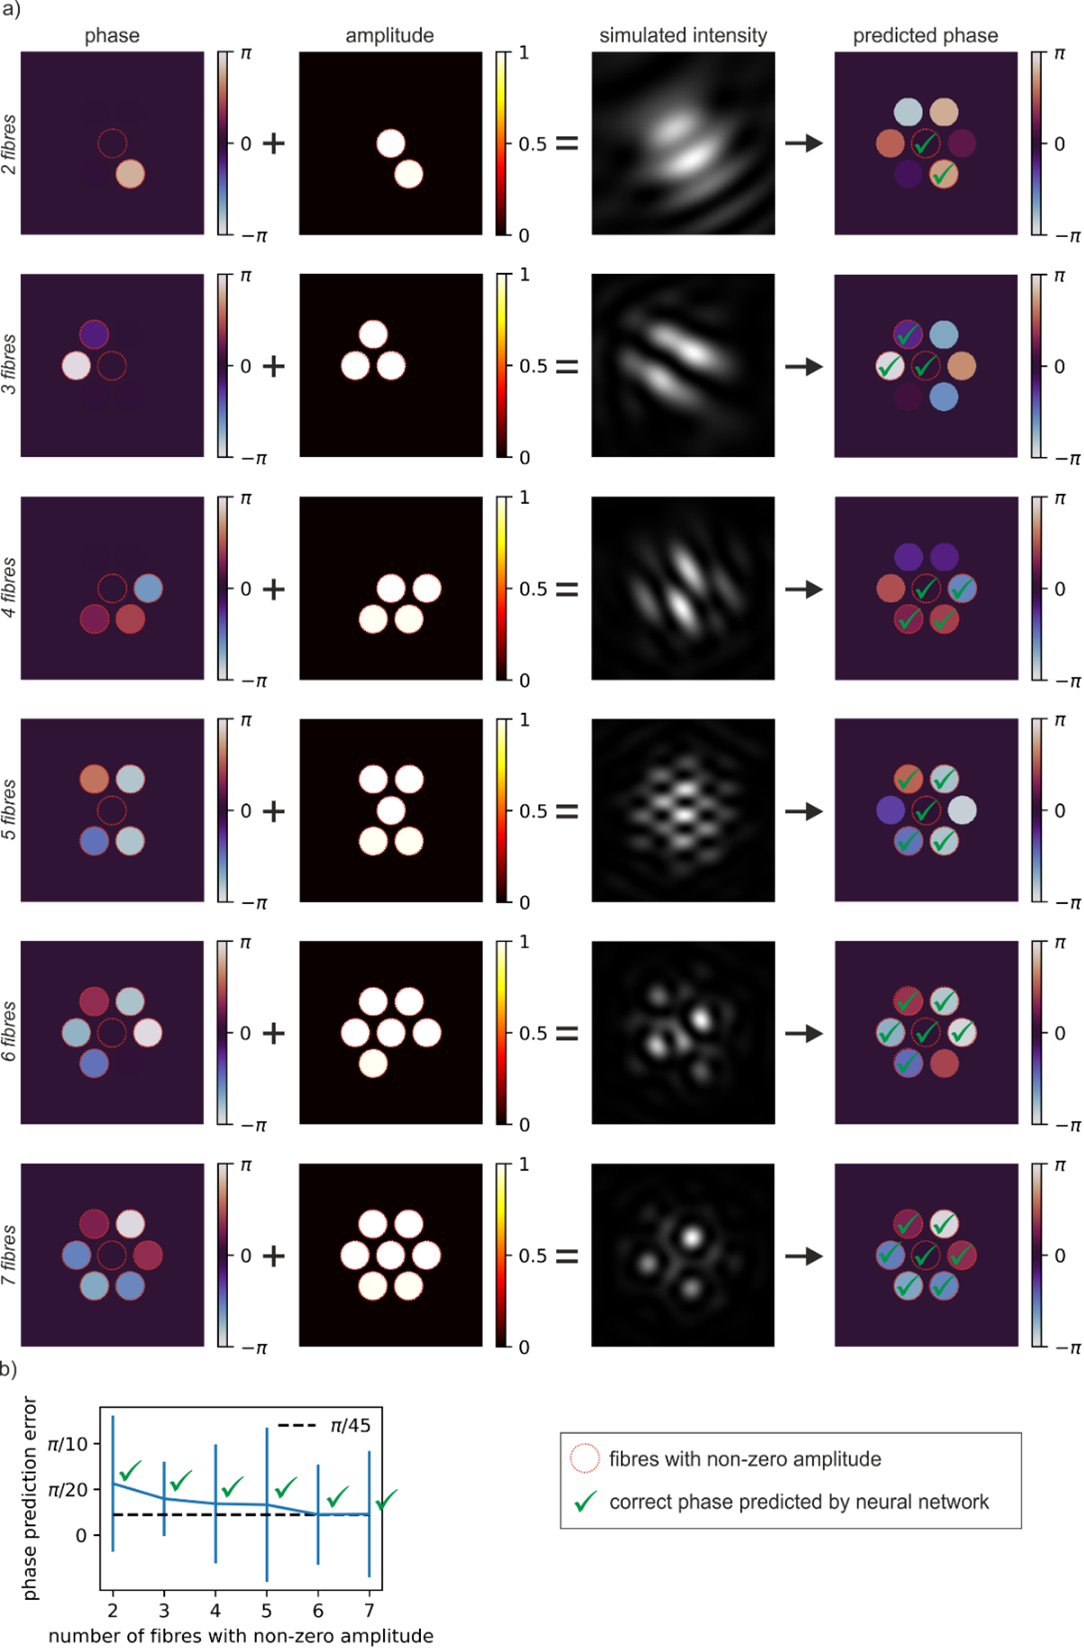
Figure_6.png Fig. 6. Showing a) phase, amplitude, and simulated intensity patterns, along with the phase values predicted by the neural network directly from the simulated intensity patterns, and b) the phase prediction error for different numbers of fibres with non-zero amplitude values.
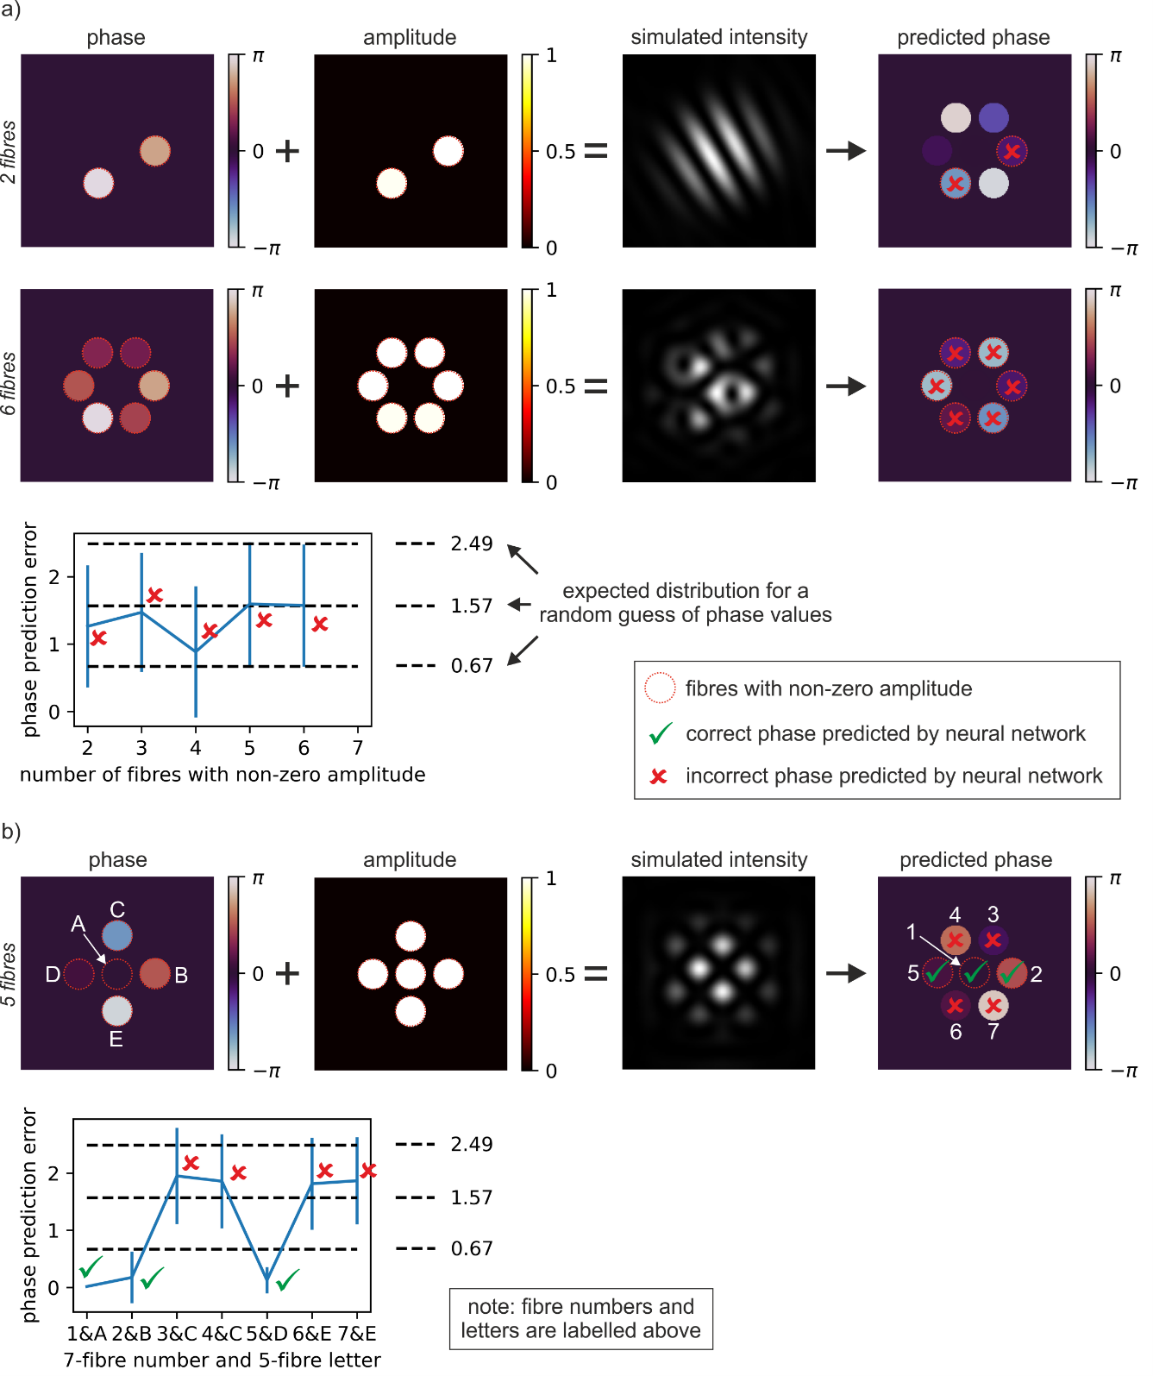
Figure_7.png Fig. 7. Showing phase, amplitude, and simulated intensity patterns, along with the phase values predicted by the neural network for a) cases where the central fibre amplitude is set to zero (i.e., removed), and b) where the positions of the fibres are changed from a 7-fibre hexagonal arrangement to a 5-fibre ‘plus’ arrangement.
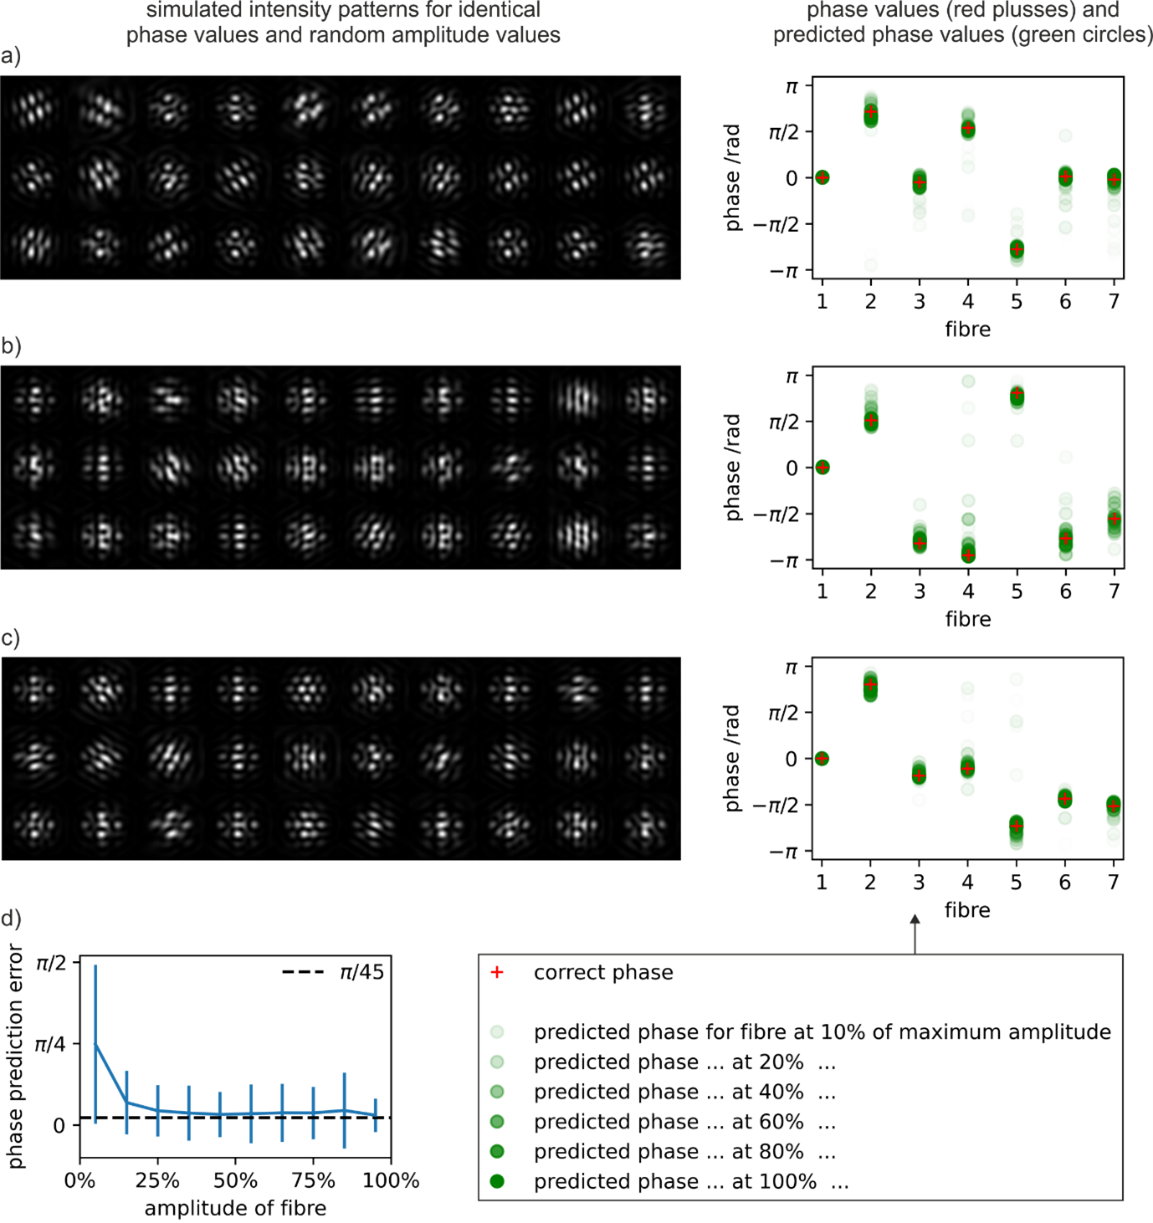
Figure_8.png Fig. 8. The capability of the neural network for predicting the phase directly from intensity patterns that correspond to amplitude values with a uniform distribution between zero and one. Showing for each of a-c), thirty examples of simulated intensity patterns corresponding to a fixed phase and random amplitude values, along with the graph showing the phase values predicted by the neural network for each of these thirty intensity patterns. Showing d), the phase prediction error for different amplitudes.
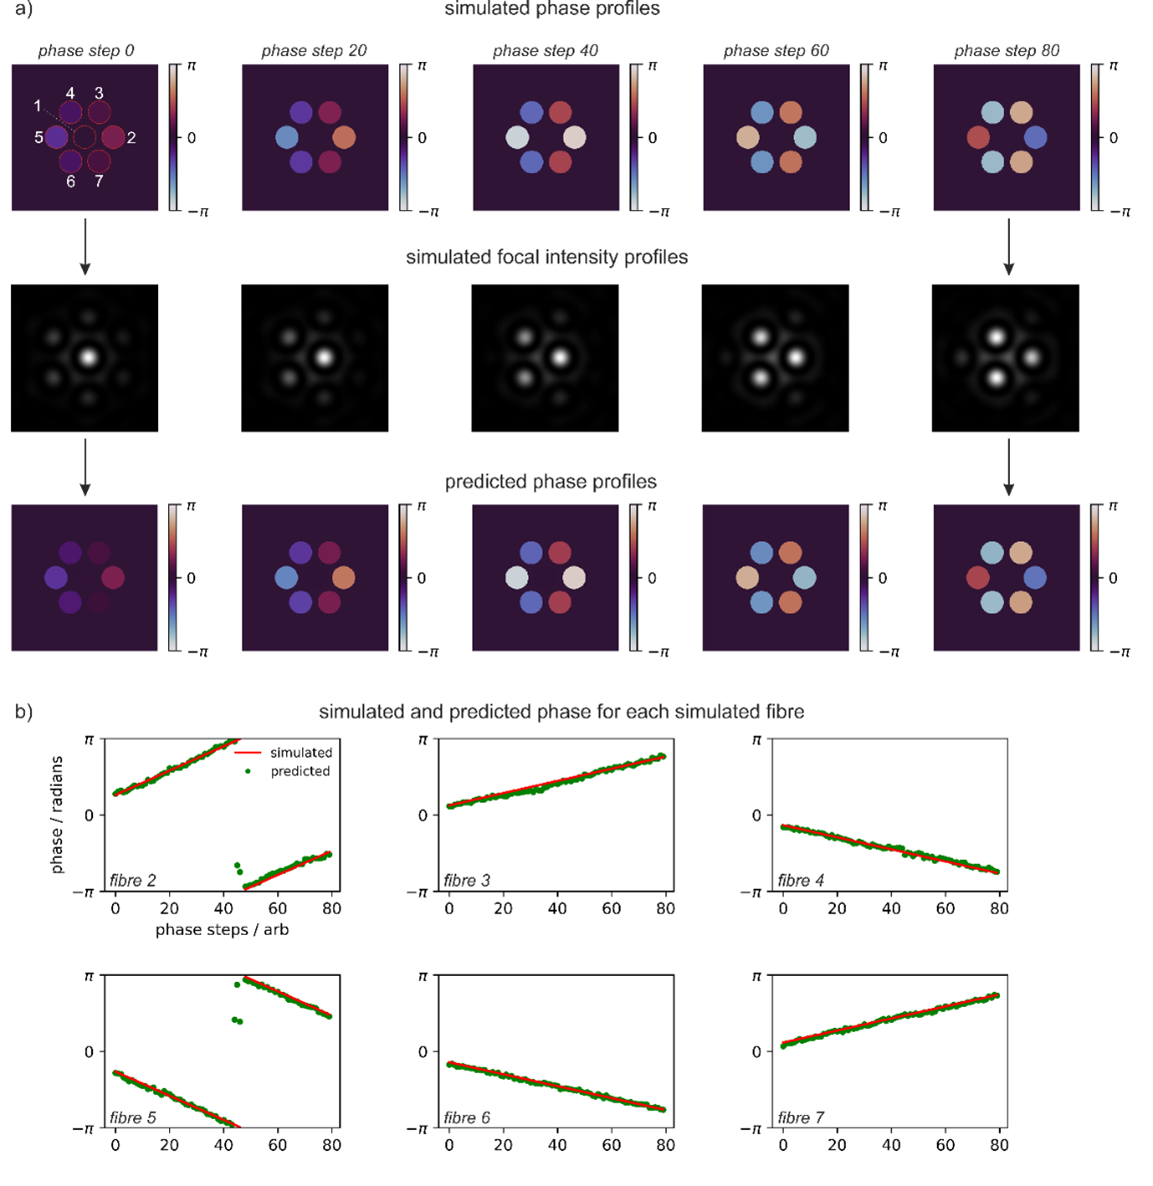
Figure_9.png Fig. 9. The capability of the neural network in identification of the phase values when a phase gradient is present in the simulation. Showing a) the simulated phase profile, the associated simulated focal intensity profile, and the prediction phase profile, for a range of phase gradients, and b) comparison of phase values for each fibre.
University of Southampton
Grant-Jacob, James
c5d144d8-3c43-4195-8e80-edd96bfda91b
Mills, Benjamin
05f1886e-96ef-420f-b856-4115f4ab36d0
Zervas, Michael
1840a474-dd50-4a55-ab74-6f086aa3f701
Grant-Jacob, James
c5d144d8-3c43-4195-8e80-edd96bfda91b
Mills, Benjamin
05f1886e-96ef-420f-b856-4115f4ab36d0
Zervas, Michael
1840a474-dd50-4a55-ab74-6f086aa3f701
Grant-Jacob, James, Mills, Benjamin and Zervas, Michael
(2022)
Dataset in support of the journal article 'Phase identification despite amplitude variation in coherent beam combination using deep learning'.
University of Southampton
doi:10.5258/SOTON/D2344
[Dataset]
Abstract
This dataset contains: Figure_1.png to Figure_9.png
The figures are as follows:
Figure_1.png Fig. 1. Simulated far-field intensity patterns corresponding to different combinations of phase values and amplitude values.
Figure_2.png Fig. 2. Showing a) that the intensity pattern for equal amplitude values is comparable to the mean of the intensity patterns for non-equal amplitude values, with quantitative metrics of b) intersection over union and c) image subtraction.
Figure_3.png Fig. 3. Simulated far-field diffraction patterns from two slits, for changing amplitude and phase values. The dotted green lines are included for assisting with visual comparison.
Figure_4.png Fig. 4. Schematic of the image-to-image network used for transforming simulated diffraction patterns into predictions of phase.
Figure_5.png Fig. 5. Concept for training and testing the neural network. The neural network is trained to identify phase values from simulated far-field intensity patterns. The training data contains intensity patterns corresponding to random phase values and equal amplitude values (the amplitudes are always set to a value of one). The testing data contains intensity patterns corresponding to random phase values and random amplitude values (the amplitudes are chosen from a uniform distribution from zero to one).
Figure_6.png Fig. 6. Showing a) phase, amplitude, and simulated intensity patterns, along with the phase values predicted by the neural network directly from the simulated intensity patterns, and b) the phase prediction error for different numbers of fibres with non-zero amplitude values.
Figure_7.png Fig. 7. Showing phase, amplitude, and simulated intensity patterns, along with the phase values predicted by the neural network for a) cases where the central fibre amplitude is set to zero (i.e., removed), and b) where the positions of the fibres are changed from a 7-fibre hexagonal arrangement to a 5-fibre ‘plus’ arrangement.
Figure_8.png Fig. 8. The capability of the neural network for predicting the phase directly from intensity patterns that correspond to amplitude values with a uniform distribution between zero and one. Showing for each of a-c), thirty examples of simulated intensity patterns corresponding to a fixed phase and random amplitude values, along with the graph showing the phase values predicted by the neural network for each of these thirty intensity patterns. Showing d), the phase prediction error for different amplitudes.
Figure_9.png Fig. 9. The capability of the neural network in identification of the phase values when a phase gradient is present in the simulation. Showing a) the simulated phase profile, the associated simulated focal intensity profile, and the prediction phase profile, for a range of phase gradients, and b) comparison of phase values for each fibre.
Image
Figure_1.png
- Image
Image
Figure_2.png
- Image
Image
Figure_3.png
- Image
Image
Figure_4.png
- Image
Image
Figure_5.png
- Image
Image
Figure_6.png
- Image
Image
Figure_7.png
- Image
Image
Figure_8.png
- Image
Image
Figure_9.png
- Image
Show all 10 downloads.
More information
Published date: 2022
Identifiers
Local EPrints ID: 475836
URI: http://eprints.soton.ac.uk/id/eprint/475836
PURE UUID: 7f80a99f-563e-41a1-91e0-9c040d81b101
Catalogue record
Date deposited: 29 Mar 2023 16:35
Last modified: 06 May 2023 01:45
Export record
Altmetrics
Contributors
Creator:
James Grant-Jacob

Creator:
Benjamin Mills
Creator:
Michael Zervas
Download statistics
Downloads from ePrints over the past year. Other digital versions may also be available to download e.g. from the publisher's website.
View more statistics