Dataset supporting the publication "Visualizing laser ablation using plasma imaging and deep learning ".
Dataset supporting the publication "Visualizing laser ablation using plasma imaging and deep learning ".

This dataset is supporting the publication "Visualizing laser ablation using plasma imaging and deep learning " published in Optics Continuum. https://doi.org/10.1364/OPTCON.495923
The data is supporting the figures from the article:
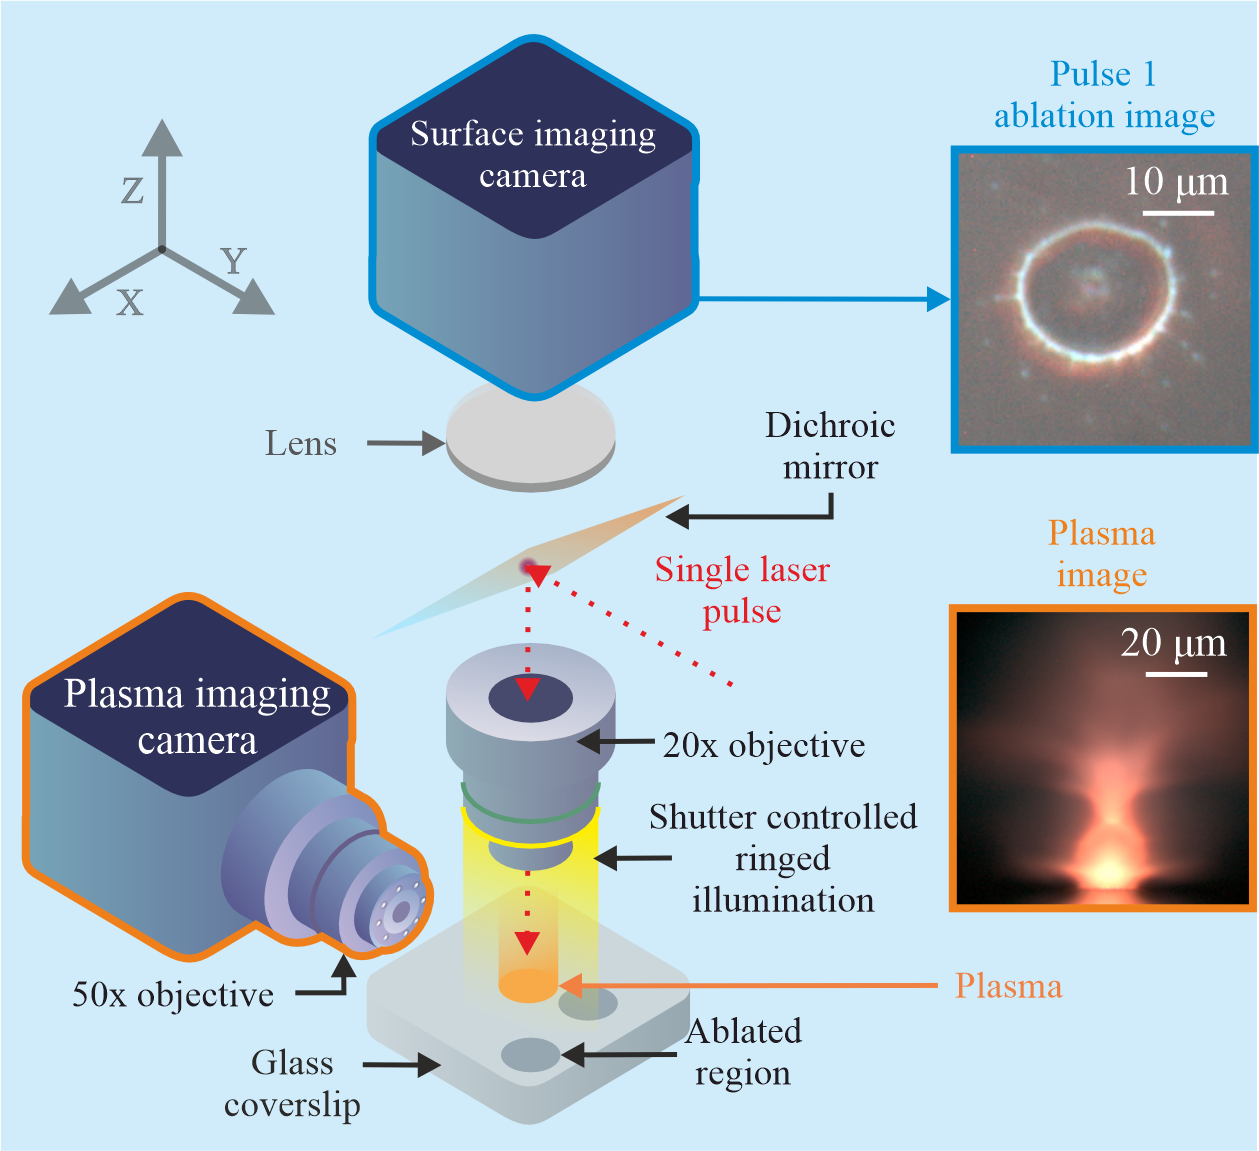
Figure_1.png Simplified diagram of the experimental setup used for recording surface images and plasma images before, during and after single pulse laser ablation. The plasma was imaged perpendicular to laser axis. The images in the figure are experimental data.
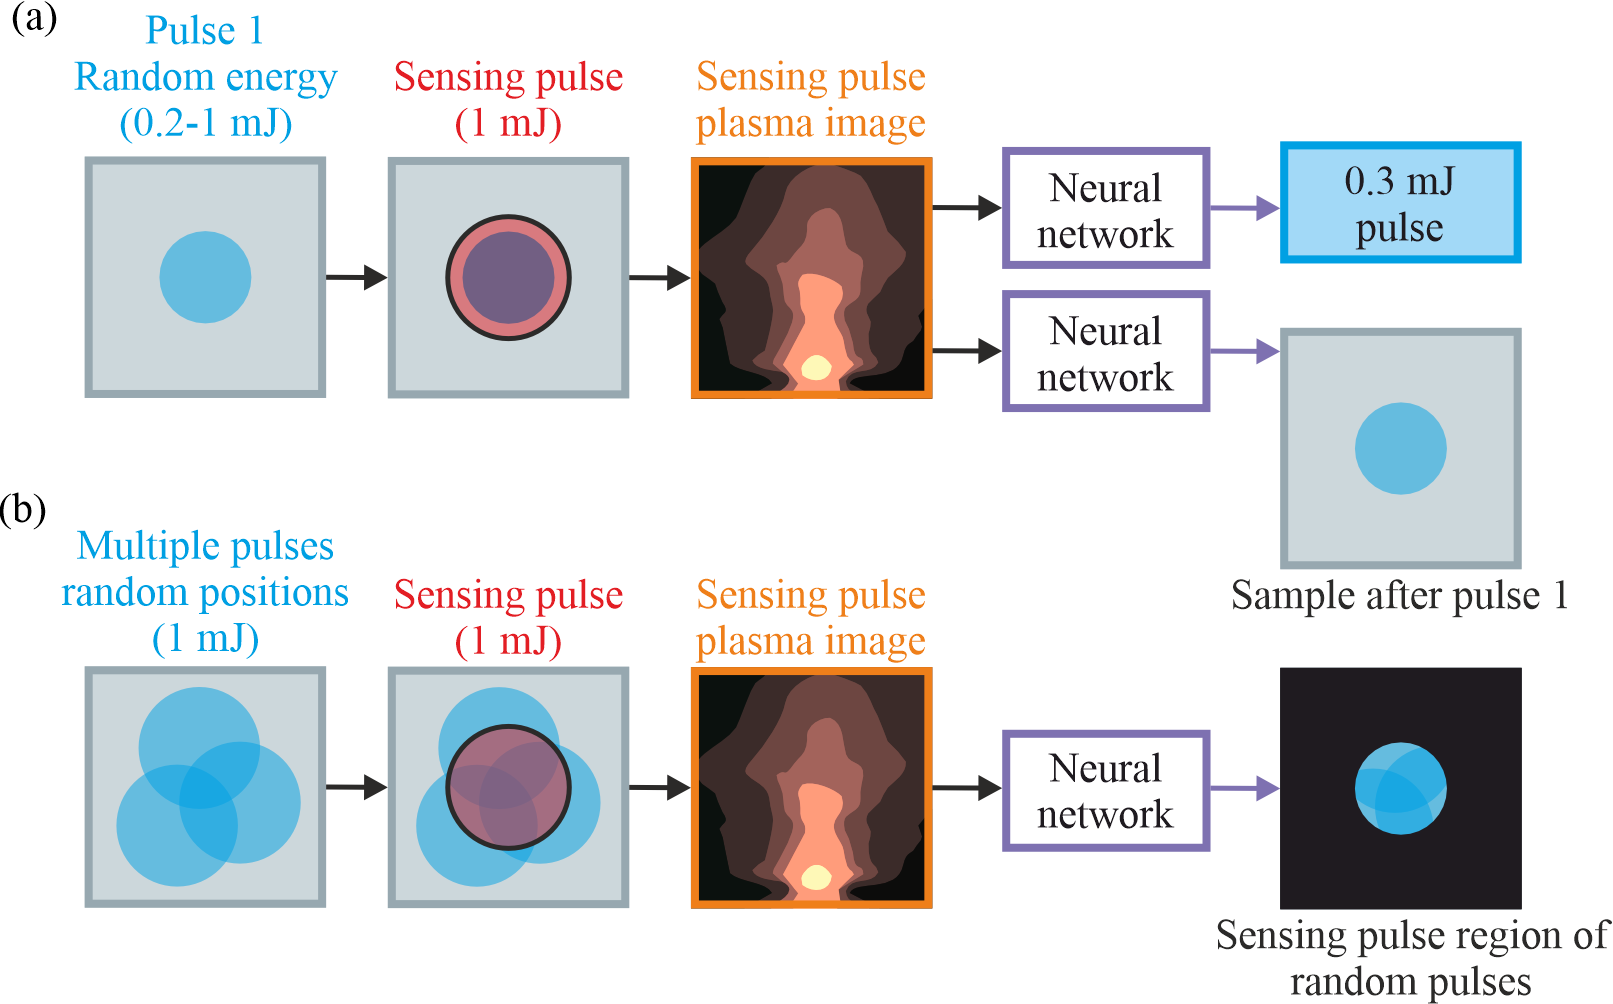
Figure_2.png Concepts of (a) the first experiment where a random pulse energy ablated the surface then a sensing pulse was incident onto the surface to produce plasma and (b) the second experiment where random pulse positions ablated a surface then a sensing pulse was incident on the surface to produce plasma. All images in the figure are schematics.
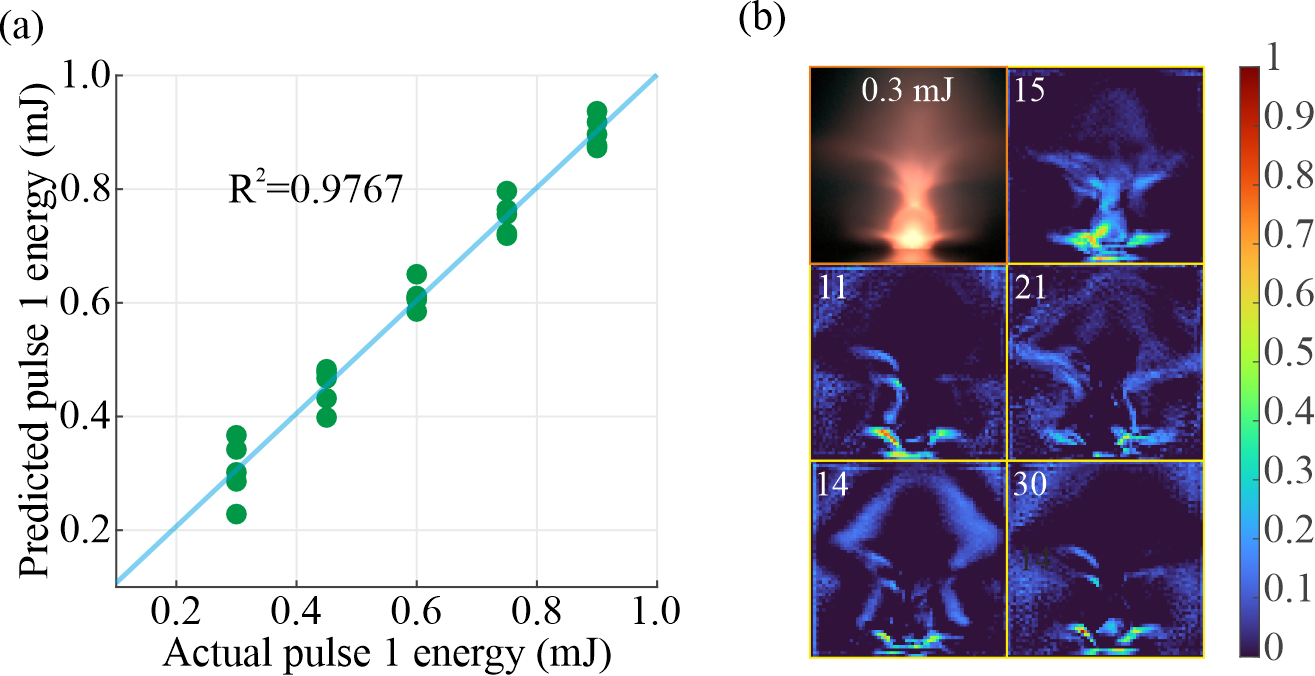
Figure_3.png (a) The capability of the neural network to predict pulse energy directly from plasma images and (b) activation maps at the dropout layer when feeding a 0.3 mJ pulse through different channels.
Figure_3.txt Data for Figure_3(a). Actual pulse 1 energy and Predicted pulse 1 energy.
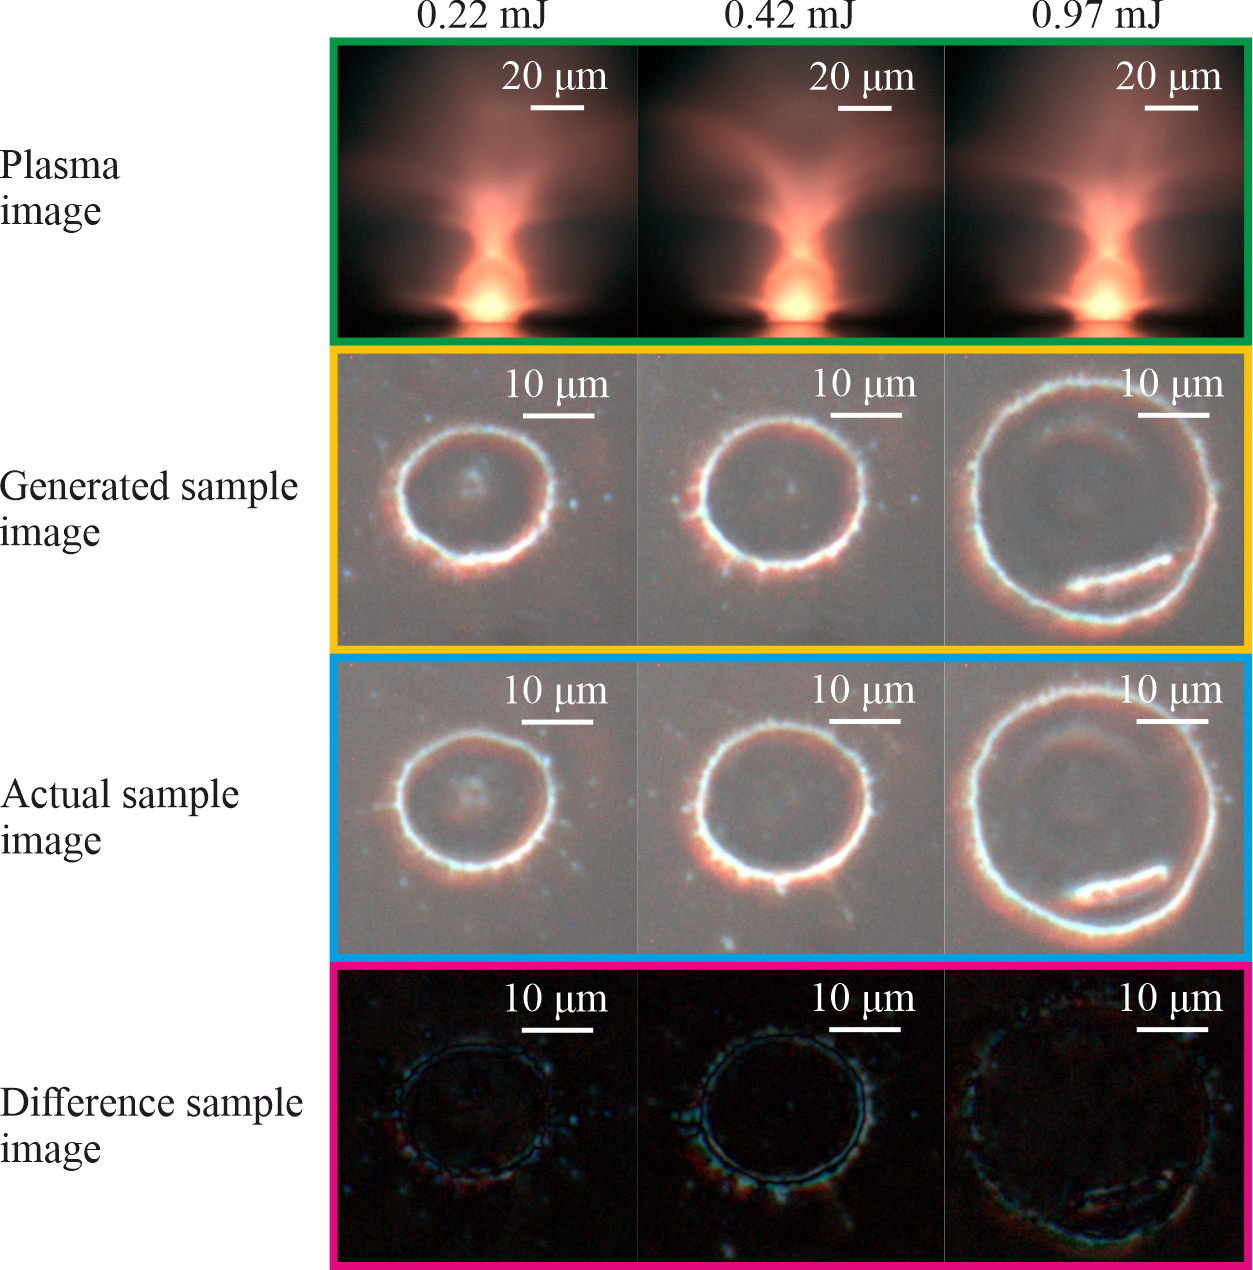
Figure_4.png The capability of the neural network to generate images of the surface resulting from a pulse with a randomly chosen pulse energy, directly from an image of the plasma produced when a subsequent pulse was incident on the sample.
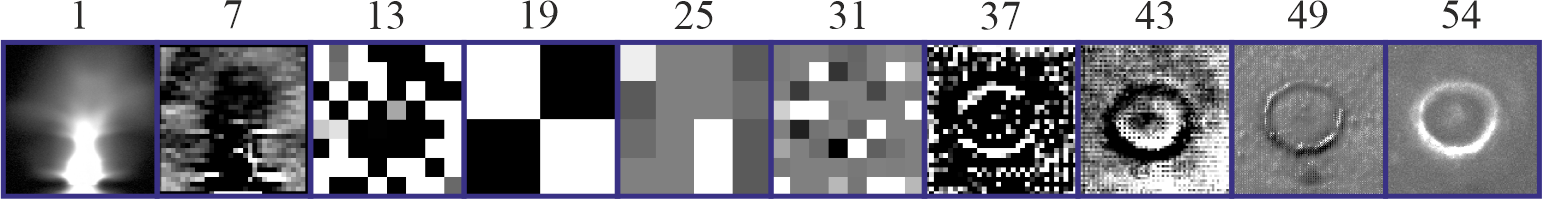
Figure_5.png Images of the first channel of each numbered layer as the result of feeding an input image (layer 1) into each numbered layer. The figure shows the transition from a plasma image to the generated surface image.
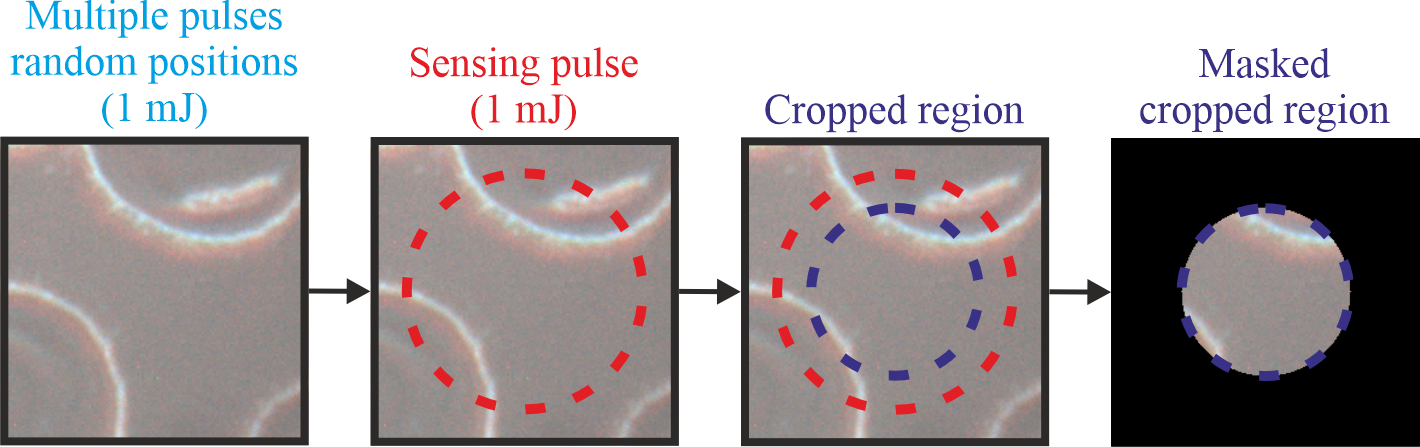
Figure_6.png The process for masking the experimentally recorded surface images, showing the position of the 1 mJ pulse (red dashed circle) and the masked region (blue dashed circle).
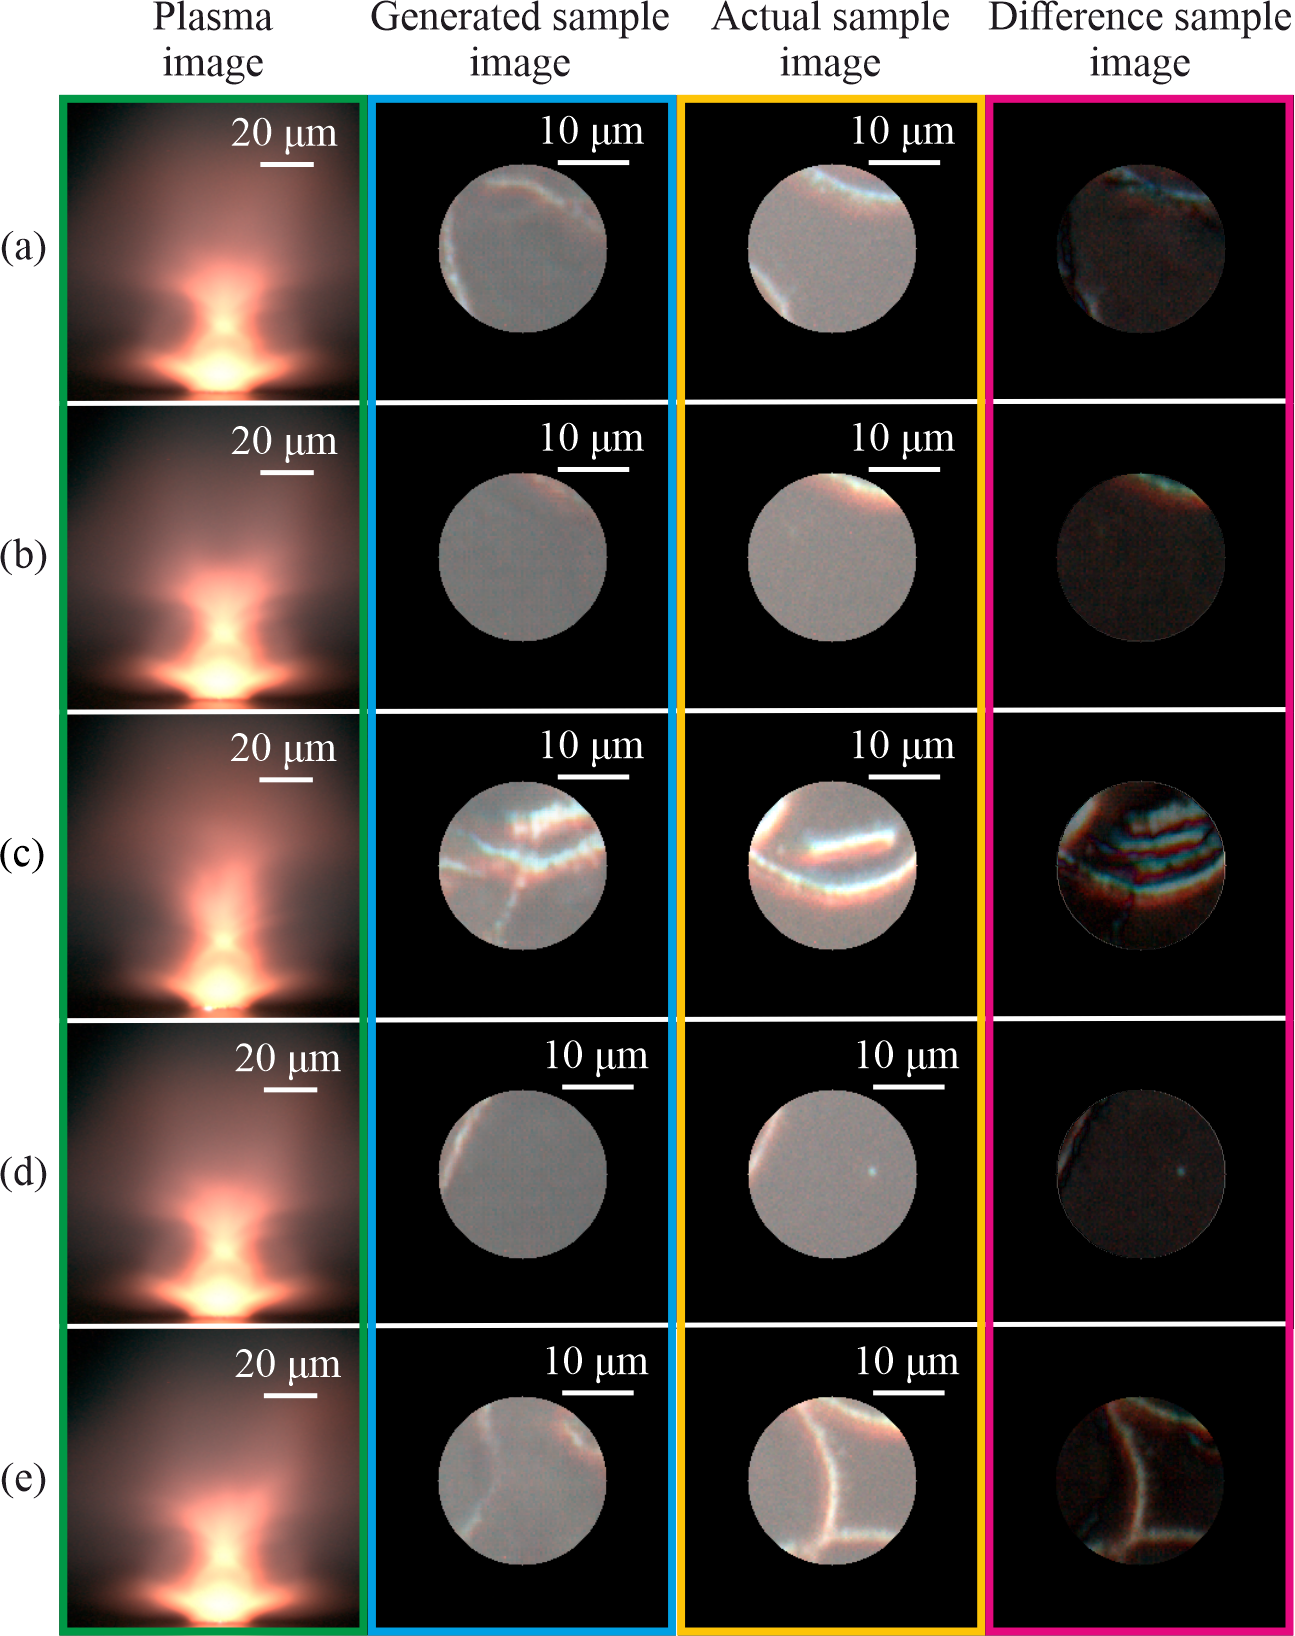
Figure_7.png The capability for visualization of a randomly ablated sample directly from the image of the plasma created from a subsequent pulse with energy of 1 mJ.
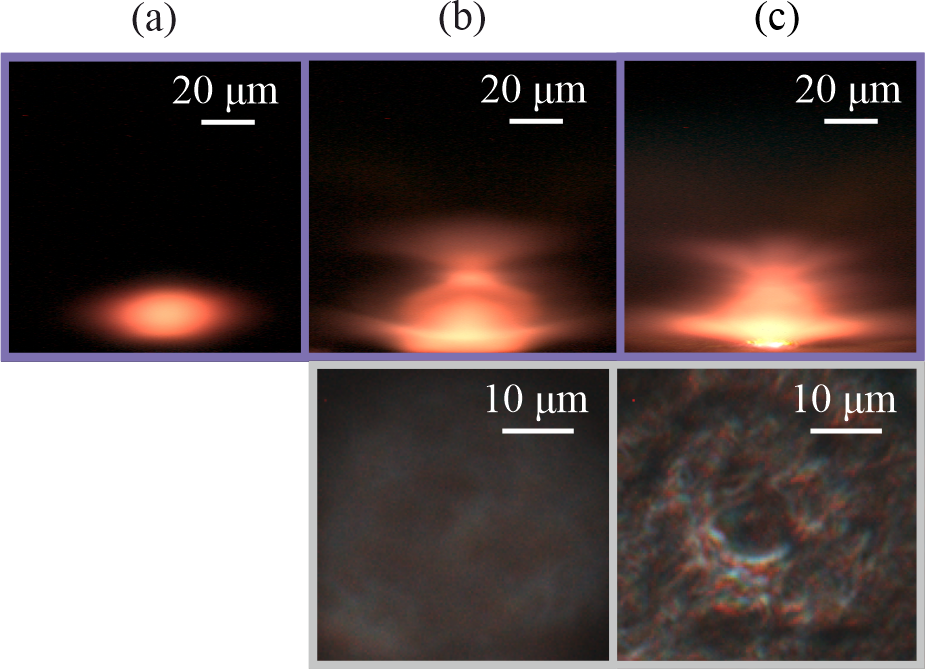
Figure_8.png Images of plasma emission (top row) and associated images of the ablated surfaces (bottom row) for (a) air, (b) cyanoacrylate and (c) carbon tape.
Licence: CC-BY
Related projects:
EPSRC grant EP/P027644/1
EPSRC grant EP/T026197/1
EPSRC grant EP/W028786/1
University of Southampton
Grant-Jacob, James
c5d144d8-3c43-4195-8e80-edd96bfda91b
Mills, Benjamin
05f1886e-96ef-420f-b856-4115f4ab36d0
Zervas, Michael
1840a474-dd50-4a55-ab74-6f086aa3f701
Grant-Jacob, James
c5d144d8-3c43-4195-8e80-edd96bfda91b
Mills, Benjamin
05f1886e-96ef-420f-b856-4115f4ab36d0
Zervas, Michael
1840a474-dd50-4a55-ab74-6f086aa3f701
Grant-Jacob, James
(2023)
Dataset supporting the publication "Visualizing laser ablation using plasma imaging and deep learning ".
University of Southampton
doi:10.5258/SOTON/D2672
[Dataset]
Abstract
This dataset is supporting the publication "Visualizing laser ablation using plasma imaging and deep learning " published in Optics Continuum. https://doi.org/10.1364/OPTCON.495923
The data is supporting the figures from the article:
Figure_1.png Simplified diagram of the experimental setup used for recording surface images and plasma images before, during and after single pulse laser ablation. The plasma was imaged perpendicular to laser axis. The images in the figure are experimental data.
Figure_2.png Concepts of (a) the first experiment where a random pulse energy ablated the surface then a sensing pulse was incident onto the surface to produce plasma and (b) the second experiment where random pulse positions ablated a surface then a sensing pulse was incident on the surface to produce plasma. All images in the figure are schematics.
Figure_3.png (a) The capability of the neural network to predict pulse energy directly from plasma images and (b) activation maps at the dropout layer when feeding a 0.3 mJ pulse through different channels.
Figure_3.txt Data for Figure_3(a). Actual pulse 1 energy and Predicted pulse 1 energy.
Figure_4.png The capability of the neural network to generate images of the surface resulting from a pulse with a randomly chosen pulse energy, directly from an image of the plasma produced when a subsequent pulse was incident on the sample.
Figure_5.png Images of the first channel of each numbered layer as the result of feeding an input image (layer 1) into each numbered layer. The figure shows the transition from a plasma image to the generated surface image.
Figure_6.png The process for masking the experimentally recorded surface images, showing the position of the 1 mJ pulse (red dashed circle) and the masked region (blue dashed circle).
Figure_7.png The capability for visualization of a randomly ablated sample directly from the image of the plasma created from a subsequent pulse with energy of 1 mJ.
Figure_8.png Images of plasma emission (top row) and associated images of the ablated surfaces (bottom row) for (a) air, (b) cyanoacrylate and (c) carbon tape.
Licence: CC-BY
Related projects:
EPSRC grant EP/P027644/1
EPSRC grant EP/T026197/1
EPSRC grant EP/W028786/1
Image
Figure_1.png
- Image
Image
Figure_2.png
- Image
Text
Figure_3.txt
- Dataset
Image
Figure_3.png
- Image
Image
Figure_4.png
- Image
Image
Figure_5.png
- Image
Image
Figure_6.png
- Image
Image
Figure_7.png
- Image
Image
Figure_8.png
- Image
Show all 10 downloads.
More information
Published date: 2023
Identifiers
Local EPrints ID: 478830
URI: http://eprints.soton.ac.uk/id/eprint/478830
PURE UUID: b6232d63-f701-4c43-82a2-4e0b74331416
Catalogue record
Date deposited: 11 Jul 2023 17:01
Last modified: 12 Jul 2023 01:40
Export record
Altmetrics
Contributors
Creator:
James Grant-Jacob

Contributor:
Benjamin Mills
Owner:
Michael Zervas
Download statistics
Downloads from ePrints over the past year. Other digital versions may also be available to download e.g. from the publisher's website.
View more statistics